Since the beginning of the year, the European market – like its peers - has suffered a severe correction. Market participants are watching out for the low point, the green light that will allow the market to reposition itself for the long term. At Candriam, we believe that European equities will evolve following a three-step waltz.
Step One: The time of Value
The market correction observed since the beginning of the year was the main source of the sharp rise in long-term interest rates in the US and Europe. This long-term rate phenomenon is impacting company valuations, and primarily so-called value/growth, more established type of companies. Currently corporate valuations have been significantly impacted by a higher discount rate of future cash flows.
Therefore, we estimate that, for a 100 basis-point increase in long-term US and European rates, value/growth stocks would shed, on average, about 15% of their value. While we cannot rule out short-term exaggeration regarding the evolution of long-term rates, we believe that we are close to a peak.
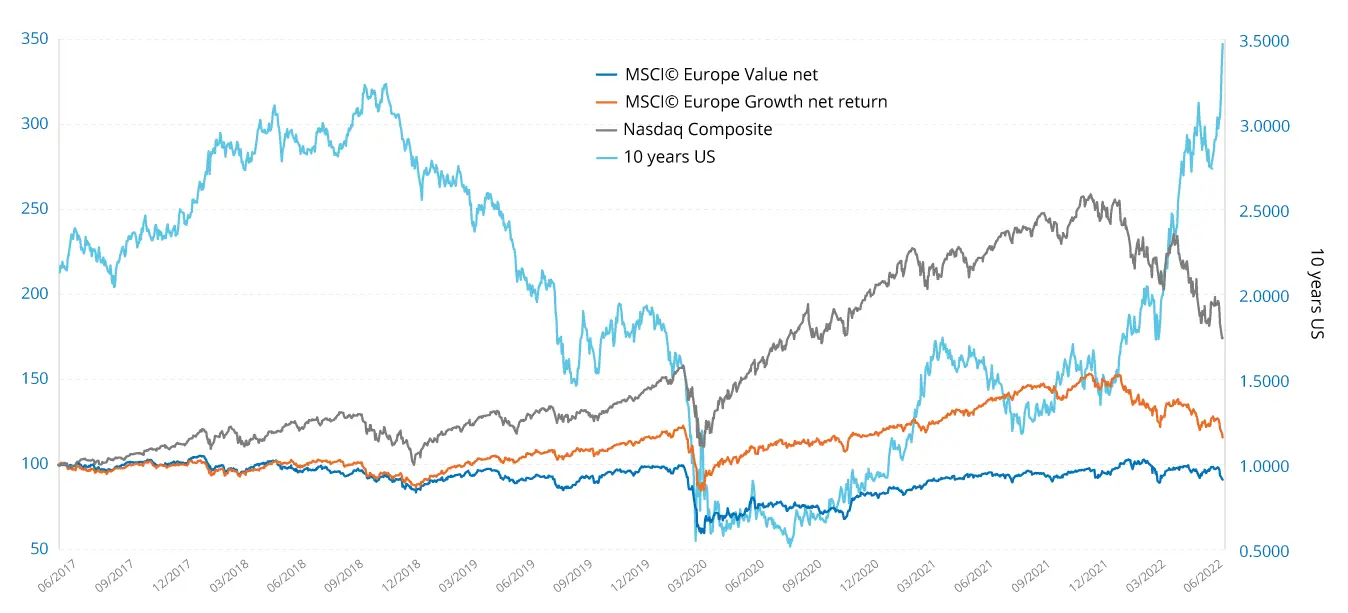
Source: Bloomberg at 14/06/2022
Past performance does not guarantee future results and is not constant over time.
However, we note that valuations on many stocks that had become excessively expensive at the end of last year have come down to relatively attractive levels, partly due to the recent market correction. By incorporating a risk-free rate of 2.5%1 into our valuation models, we obtain average upside potential of around 20% for our strategy invested in innovative European equities2, with a fairly strong earnings trend. While our economists’ expectations on rates are confirmed, we believe it is more than likely that we are approaching the end of this initial phase of the market selloff. Despite continued volatility, in our view the market may be close to the peak on long-term rates and core inflation3, especially in the United States. The floor, mainly for growth stocks, is therefore likely to be reached quickly, and should allow these stocks to benefit from a substantial upside potential. Not to mention that the value/growth portion of the market, which includes innovative stocks, creates on average an 8%-10% valuation4 per year without even having to beat the consensus. Innovative companies also tend to often surprise the market with higher than expected earnings per share.
MSCI Europe Growth Net Return EUR Index / MSCI Europe Value Net Return EUR Index
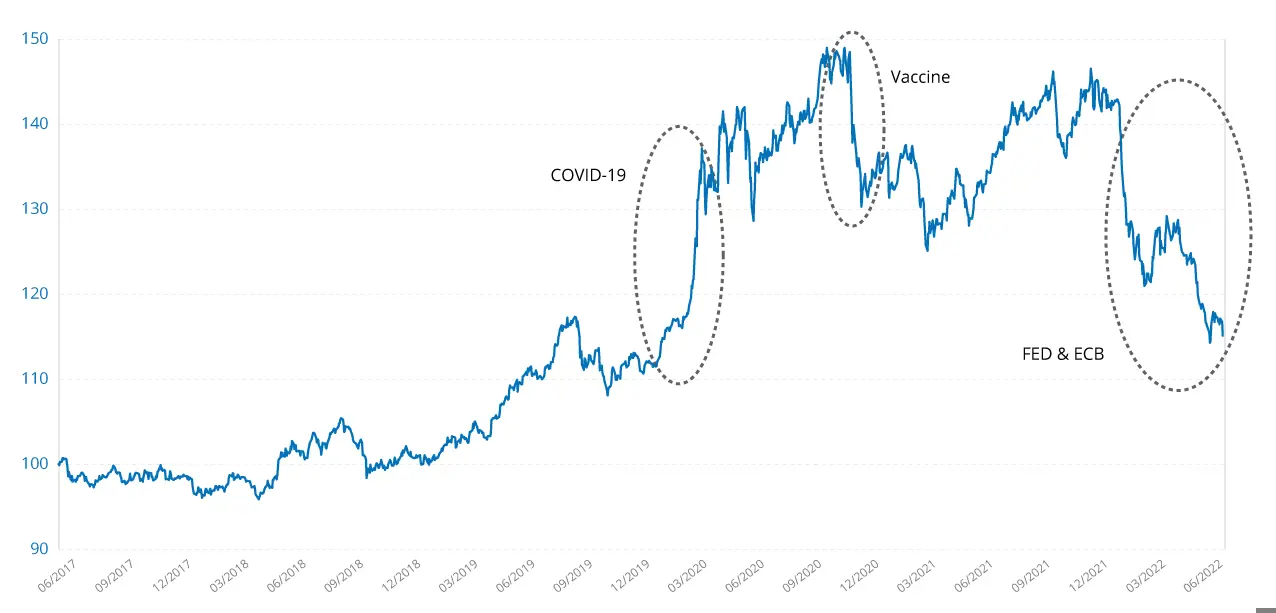
Relative performance MSCI Europe GROWTH net return / MSCI Europe VALUE. Net return, base 100, over 5 years. Source: Bloomberg at 14/06/2022.
Past performance does not guarantee future results and is not constant over time
- Growth stocks, usually defined by higher profit growth, generally sell at higher valuations. The MSCI© Europe Growth index, designed to represent 50% of the market capitalisation of MSCI© Europe, is defined through the factorial analysis of short- and long-term growth in earnings per share (EPS) and current growth and historical long-term growth in EPS and sales.
- Value stocks are generally defined as having a lower price relative to profits or assets. For the MSCI© Europe Value index, they are defined using a factorial model of book value relative to price, long-term P/E* and dividend yields.
* P/E: stock ratio corresponding to the ratio of a company’s stock market value to its profits
Step two: the return of Growth
On the one hand, the various actions taken by central banks, primarily the reduction of their balance sheets and interest rates increases, are fuelling the economic slowdown.
On the other hand, most countries are suffering as a result of excessive debt levels and deficits. It is therefore extremely difficult for them to support growth in such a context. The United States, struggling to pass its investment plans, is the perfect illustration of this.
In the coming quarters, we should see - in addition to the existing problems on margins - serious risks on revenues. Once the rise in long-term rates is priced in by the market, we should move to a “normal” earnings cycle. Some companies will naturally see a slowdown in profits, others will see them hold up, while the big winners will be those that succeed in benefiting from the accelerating niches. Growth stocks generally outperform during these economic downturns, but selectivity remains paramount for investors. We see many niches that should structurally allow for this level of visibility, even a gain in market share and a pick-up in earnings in the coming years, particularly for companies active in the energy transition, new healthcare technologies, digitalisation and automation sectors of the economy.
Step Three: Green Light for Cyclicals
The start of this third phase should be determined by the floor reached by the markets in the broad sense. This level will determine when investors will be able to reposition themselves over the long term in a bull market.
We believe that growth stocks, as explained above, are probably close to the bottom in the latest correction. The Nasdaq, a perfect example for this type of stock, which has fallen from more than 16,000 points to around 11,0005, suggests that the bulk of the correction is behind us. We could see a last downwards movement, but the level of resilience for earnings is undoubtedly close.
As for value stocks, we believe mining and oil companies are very expensive at these levels. They include historically high commodity prices, driven by temporary supply deficits. However, as the current global economic slowdown is expected to continue into 2023, these commodity markets should rebalance.
In addition, we have historically seen that the markets and particularly cyclical stocks anticipate the new phase of an economic cycle 6-12 months in advance. While determining the precise timing remains extremely difficult, we can expect a low in the markets by the end of 2023. On the other hand, we cannot rule out that any sign of a lull in inflation, central bank policy and, above all, employment in the United States, could fuel a temporary, short-term rebound on the markets. However, this potential rebound in the stock market should serve as an opportunity for profit-taking rather than be interpreted as a signal of a real sustainable economic recovery.
1 The risk-free rate is calculated based on the exposure of companies’ income in Europe and the United States; the European rate used is 2.25% and the US rate is 3.25%.
2 Average upside potential on all the securities making up the Innovation portfolio and taking into account closing share prices on 17 June 2022.
3 Core or underlying inflation is the change in the cost of goods and services, but does not include those of the food and energy sectors.
4 Average annual historical estimate since 31.12.2016 based on the Innovation portfolio on 17 June 2022.
5 Nasdaq 100: 16,565 points on 27.12.2021; 11,037 points on 16.06.2022